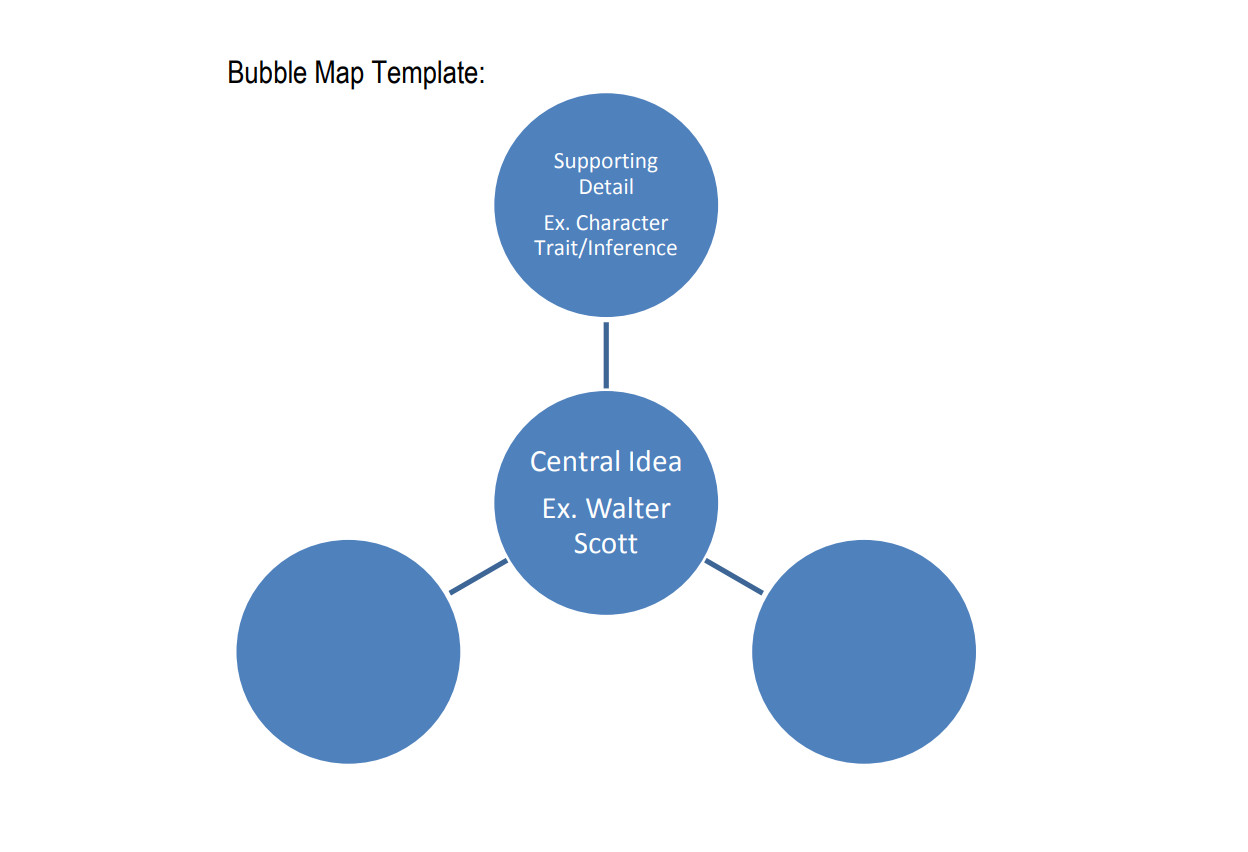
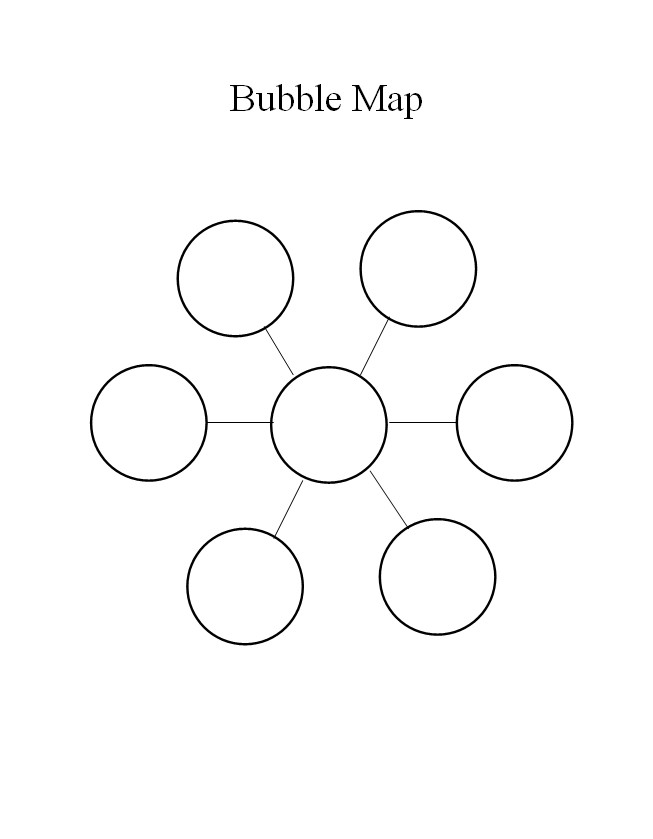
If you’ve ever struggled to organize complex information or ideas, then bubble maps are the perfect visual tool for you. Designed to simplify and clarify concepts, these templates allow you to create a central bubble representing the main idea, and then connect it to related bubbles through lines.
Whether you’re a student, teacher, or professional, our collection of free printable bubble map templates in various formats, such as Word and PDF, will help you easily map out your thoughts and communicate them.
This article will explore the ins and outs of bubble maps, providing you with all the information you need to create visually appealing and informative maps. So let’s dive in and discover the power of bubble maps together!


Know More about Bubble Map
A bubble map is a visual tool used to organize and represent complex ideas or concepts in a clear and organized format. It consists of a central bubble representing the main concept, with related elements written in surrounding bubbles connected by lines.
This method is beneficial for presenting information in-office presentations, planning projects, analyzing stories, and explaining concepts to students. These diagrams provide a visually appealing and easily understandable way to classify and organize information.


Benefits of a Bubble Map
The benefits of using a bubble map are numerous and can greatly enhance the understanding and organization of complex information. Here are some key advantages:
- Visual Representation: These diagrams provide a visually appealing and easily understandable way to represent information. The use of bubbles and lines helps to create a clear and concise visual hierarchy.
- Association Display: These diagrams excel at displaying the associations between different elements. By placing related items in bubbles around a central concept, the connections and relationships become readily apparent.
- Classification: These diagrams allow for the effective classification of information. By grouping related items, it becomes easier to identify patterns and similarities.
- Efficient Learning and Analysis: These diagrams are a valuable tool for learning, analyzing, and retaining information. The visual nature of the map aids in comprehension and facilitates the identification of key concepts.
- Educational Tool: These diagrams are particularly useful in educational settings. They help students understand the main concept, its related elements, and the relationships between them. Teachers can utilize bubble maps to clarify and reinforce important ideas.
- Office Presentations: These diagrams are an excellent tool for office presentations. They enable the efficient communication of ideas and concepts, making it easier for colleagues to grasp complex information.
- Project Planning: These diagrams can assist in the planning of new projects. By organizing ideas and related elements, project managers can better understand the project’s scope and requirements.


When We Use Bubble Map?
Bubble maps are used in various contexts to visually represent complex data and concepts in an organized manner. They are particularly useful when dealing with intricate or difficult-to-understand information, allowing for easy comprehension and organization.
These diagrams find applications in fields such as literature, science, education, office presentations, and project planning such as interior design projects. They serve as an effective tool for illustrating central ideas, classifying related elements, displaying associations, and aiding in learning and analysis.
Whether explaining concepts to students or presenting ideas to colleagues, these diagrams provide a visually appealing and efficient way to convey information.
How to Create a Bubble Map
To create a bubble map, follow these step-by-step instructions:
- Step 1: Download a free printable bubble map template in Word or any other preferred format, or create a blank document.
- Step 2: Open a blank document and go to the “Insert” tab.
- Step 3: Click on “Shapes” and select the circle shape from the icons list.
- Step 4: Click in the center of the document and drag to draw the main idea circle. Resize it as needed.
- Step 5: Write down the main idea within the central circle.
- Step 6: Add more circles to map out related things or concepts. Write down these ideas within the respective circles.
- Step 7: Connect the circles that are associated with each other using straight lines from the shape options.
- Step 8: Save the document by going to the “File” tab, selecting “Save As,” and providing a name for the file.
- Step 9: Print the bubble map or use it within a Word file for presentations, reports, project planning, or any other purpose.
Creating a bubble map using these steps will help you visually organize and classify ideas or concepts in an easily understandable format. It is a useful tool for teachers to explain concepts to students and can be used in various professional settings for effective communication and analysis.


Final Thoughts
Bubble map templates are invaluable tools for visualizing complex ideas and concepts. Whether you’re a student, teacher, or professional, these templates provide a clear and organized way to map out information and make connections.
With the availability of free printable templates in various formats, such as Word and PDF, creating a bubble map has never been easier. By following a few simple steps, you can easily create a visually appealing and informative diagram that will enhance your understanding and communication of important concepts.
So why not give it a try and unlock the power of bubble maps in your next project or presentation?