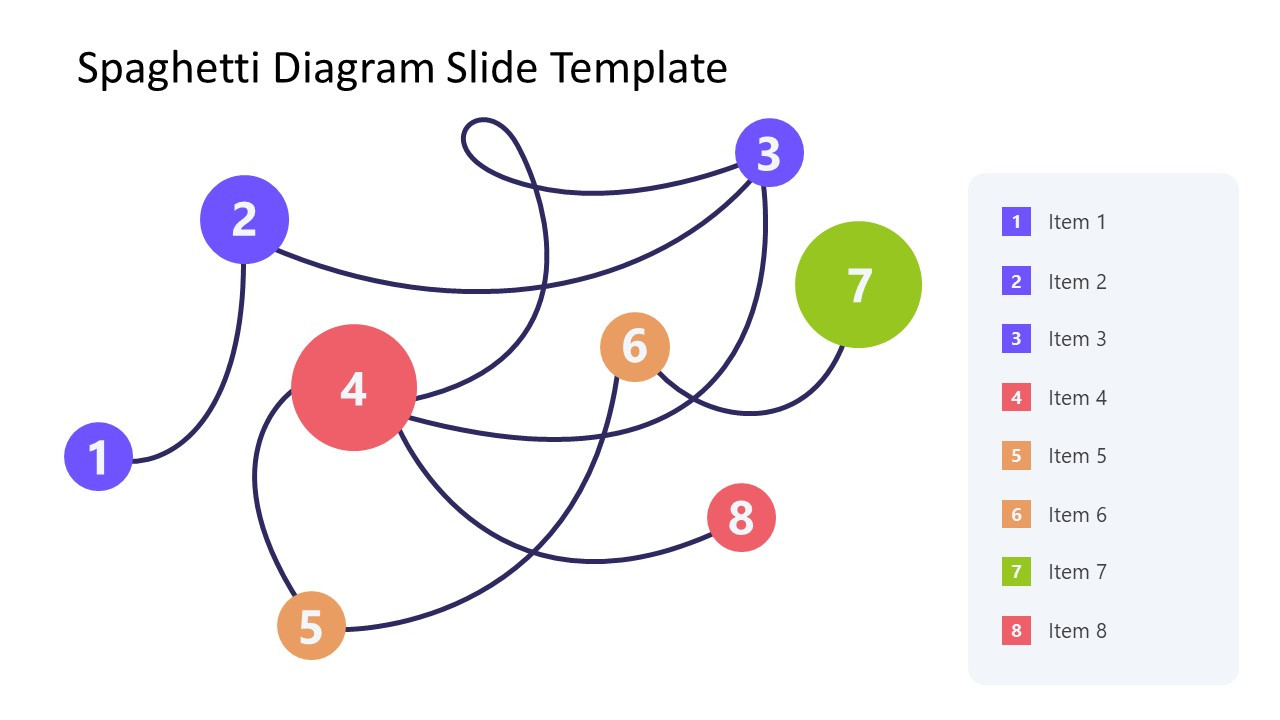
Spaghetti Chart: Navigating Through Complexity
In the world of process improvement and optimization, the spaghetti chart is a tool that is commonly used to visualize and understand the flow of work within a system. Named for its resemblance to a plate of tangled spaghetti, this chart helps to identify inefficiencies, bottlenecks, and areas of improvement within a process. By mapping out the movement of people, materials, or information, organizations can gain valuable insights into how to streamline operations and increase productivity.
What is a Spaghetti Chart?

Image Source: slidemodel.com
A spaghetti chart is a visual representation of the movement of people, objects, or information within a process. It is created by tracking the path of each entity as it moves through various stages or locations. The result is a tangled web of lines that shows the complexity and interconnectedness of the process. By analyzing the spaghetti chart, organizations can identify areas where movement is inefficient, redundant, or prone to errors.
The Purpose of Using a Spaghetti Chart

Image Source: website-files.com
The main purpose of using a spaghetti chart is to identify inefficiencies and bottlenecks within a process. By visually mapping out the flow of work, organizations can pinpoint areas where improvements can be made to streamline operations and increase efficiency. The spaghetti chart provides a clear picture of how people, materials, or information move through a system, allowing stakeholders to see where delays occur, where resources are underutilized, and where there is potential for improvement.
Why Use a Spaghetti Chart?
Spaghetti charts are a valuable tool for process improvement because they provide a visual representation of the flow of work. This visual representation makes it easier to identify patterns, trends, and inefficiencies that may not be immediately apparent when looking at raw data or reports. By seeing the flow of work laid out in front of them, stakeholders can gain a better understanding of how the process operates and where improvements can be made.
How to Create a Spaghetti Chart

Image Source: nightingaledvs.com
Creating a spaghetti chart is a relatively simple process that only requires a few basic tools. To create a spaghetti chart, follow these steps:
1. Identify the process you want to map out: Choose a specific process or workflow that you want to analyze and improve.
2. Gather data: Observe the movement of people, materials, or information within the chosen process and record this data.
3. Create a base map: Draw a simple diagram or layout of the process, including all relevant stages or locations.
4. Plot the movement: Use different colored lines to represent the movement of each entity through the process. Start at the beginning of the process and trace the path all the way through to the end.
5. Analyze the chart: Look for patterns, bottlenecks, and areas of inefficiency within the chart. Identify areas where improvements can be made to streamline the process.
Tips for Successful Use of Spaghetti Charts

Image Source: quality-assurance-solutions.com
When using spaghetti charts for process improvement, consider the following tips to ensure success:
1. Keep it simple: Focus on mapping out the main flow of work and avoid getting bogged down in unnecessary details.
2. Involve stakeholders: Get input from the people who actually work within the process to gain valuable insights and suggestions for improvement.
3. Use color coding: Differentiate between different types of movement or entities using different colors to make the chart easier to read and analyze.
4. Update regularly: Processes can change over time, so make sure to update your spaghetti chart periodically to reflect any changes or improvements that have been made.
5. Focus on solutions: Use the insights gained from the spaghetti chart to implement practical solutions that will improve the efficiency and effectiveness of the process.
6. Communicate findings: Share the spaghetti chart and any proposed improvements with all stakeholders to ensure buy-in and collaboration on implementing changes.
7. Measure results: After implementing improvements, track the results and measure the impact on key metrics such as productivity, cycle time, and error rates.
8. Continuously improve: Process improvement is an ongoing effort, so continue to use spaghetti charts and other tools to identify new opportunities for optimization and enhancement.

Image Source: ctfassets.net

Image Source: ytimg.com

Image Source: miro.com