When it comes to organizing and comparing information, a T-chart is a simple yet effective tool that can be used in a variety of settings. Whether you are a student working on a school project, a professional in a business meeting, or simply someone trying to make a decision, a T-chart can help you visually organize your thoughts and weigh the pros and cons of different options.
What is a T-Chart?
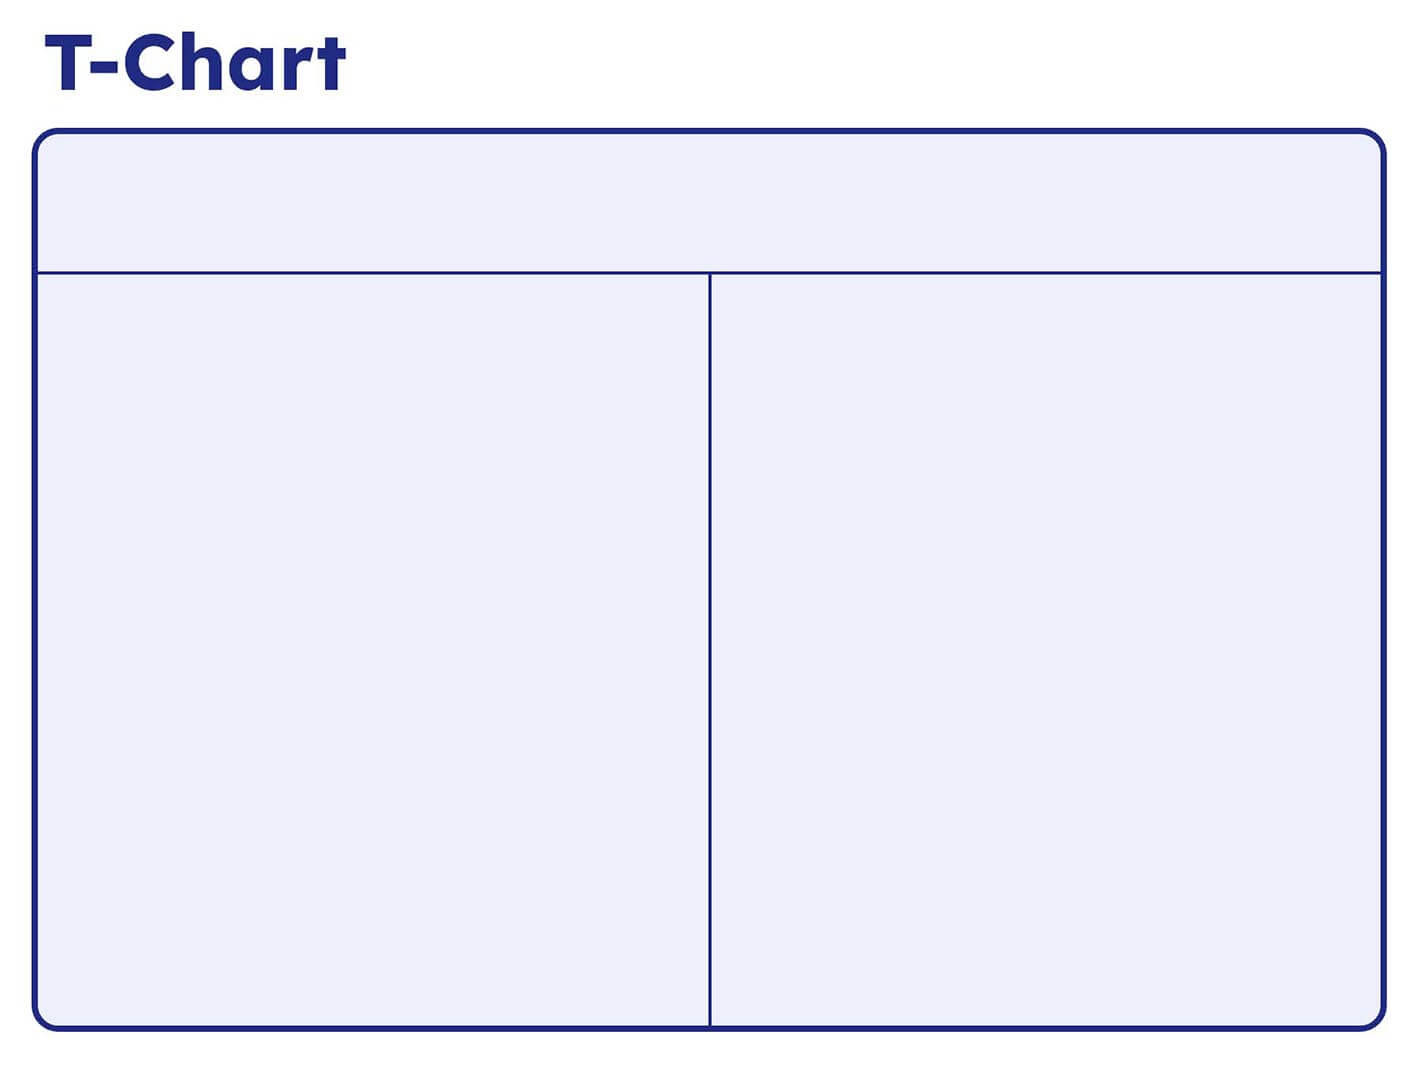
A T-chart is a graphic organizer that is divided into two columns, typically labeled Pros and Cons. The chart gets its name from its shape, which resembles the letter T. The left side of the chart is used to list the advantages or positive aspects of a topic, while the right side is used to list the disadvantages or negative aspects. This simple format allows for easy comparison and analysis of information.
The Purpose of a T-Chart

Image Source: canva.com
The main purpose of a T-chart is to help individuals organize and compare information in a clear and concise manner. By visually separating the pros and cons of a topic, decision-makers can easily see the different factors at play and make more informed choices. T-charts are commonly used in educational settings to help students analyze texts, brainstorm ideas, or compare different concepts. In professional settings, T-charts can be used to evaluate business strategies, assess project options, or weigh the advantages and disadvantages of a particular course of action.
Why Use a T-Chart?
There are several reasons why using a T-chart can be beneficial. First, T-charts provide a visual representation of information, making it easier for individuals to process and understand complex ideas. Additionally, T-charts allow for a systematic approach to organizing thoughts and analyzing data, leading to more logical and well-thought-out decisions. By clearly outlining the pros and cons of a topic, T-charts can help individuals weigh the importance of different factors and prioritize their choices.
How to Create a T-Chart

Image Source: ctfassets.net
Creating a T-chart is simple and can be done using basic materials such as paper and pen, or digital tools like word processing software or online graphic organizers. To create a T-chart, draw a vertical line down the center of your paper to divide it into two columns. Label the left column Pros and the right column Cons. Then, list the advantages and disadvantages of your topic in their respective columns. You can customize your T-chart by adding more columns or sections as needed to fit the specific requirements of your project.
Tips for Successful T-Chart Usage
Be Specific: When listing pros and cons, be as detailed and specific as possible to ensure a comprehensive analysis.
Consider Context: Take into account the context of your topic when evaluating pros and cons to make more relevant comparisons.
Update as Needed: T-charts are dynamic tools that can be updated as new information becomes available or circumstances change.
Use Color Coding: To visually differentiate between pros and cons, consider using different colors for each column.
Seek Feedback: Share your T-chart with others to gain different perspectives and insights on the topic at hand.
Practice Regularly: The more you use T-charts, the more comfortable and proficient you will become at organizing and analyzing information.

Image Source: boardmix.com

Image Source: sanity.io

Image Source: bookcreator.com